Historic floods
of Earth
An interactive WebGIS collection of peer-reviewed datasets of historic floods from around the world.
Loading flood data...
Explore the WebGIS, its data and supporting references.
An interactive WebGIS collection of peer-reviewed datasets of historic floods from around the world. The current flood catalogues are NKUA for Greece and HANZE for Europe. Greek rivers and river basins are available as geographic reference layers.
Evelpidou, N., Karkani, E., Saitis, G., Spyrou, E., & Liaskos, A. (2026). Historic Floods [Interactive WebGIS]. National and Kapodistrian University of Athens. historicfloods.org.
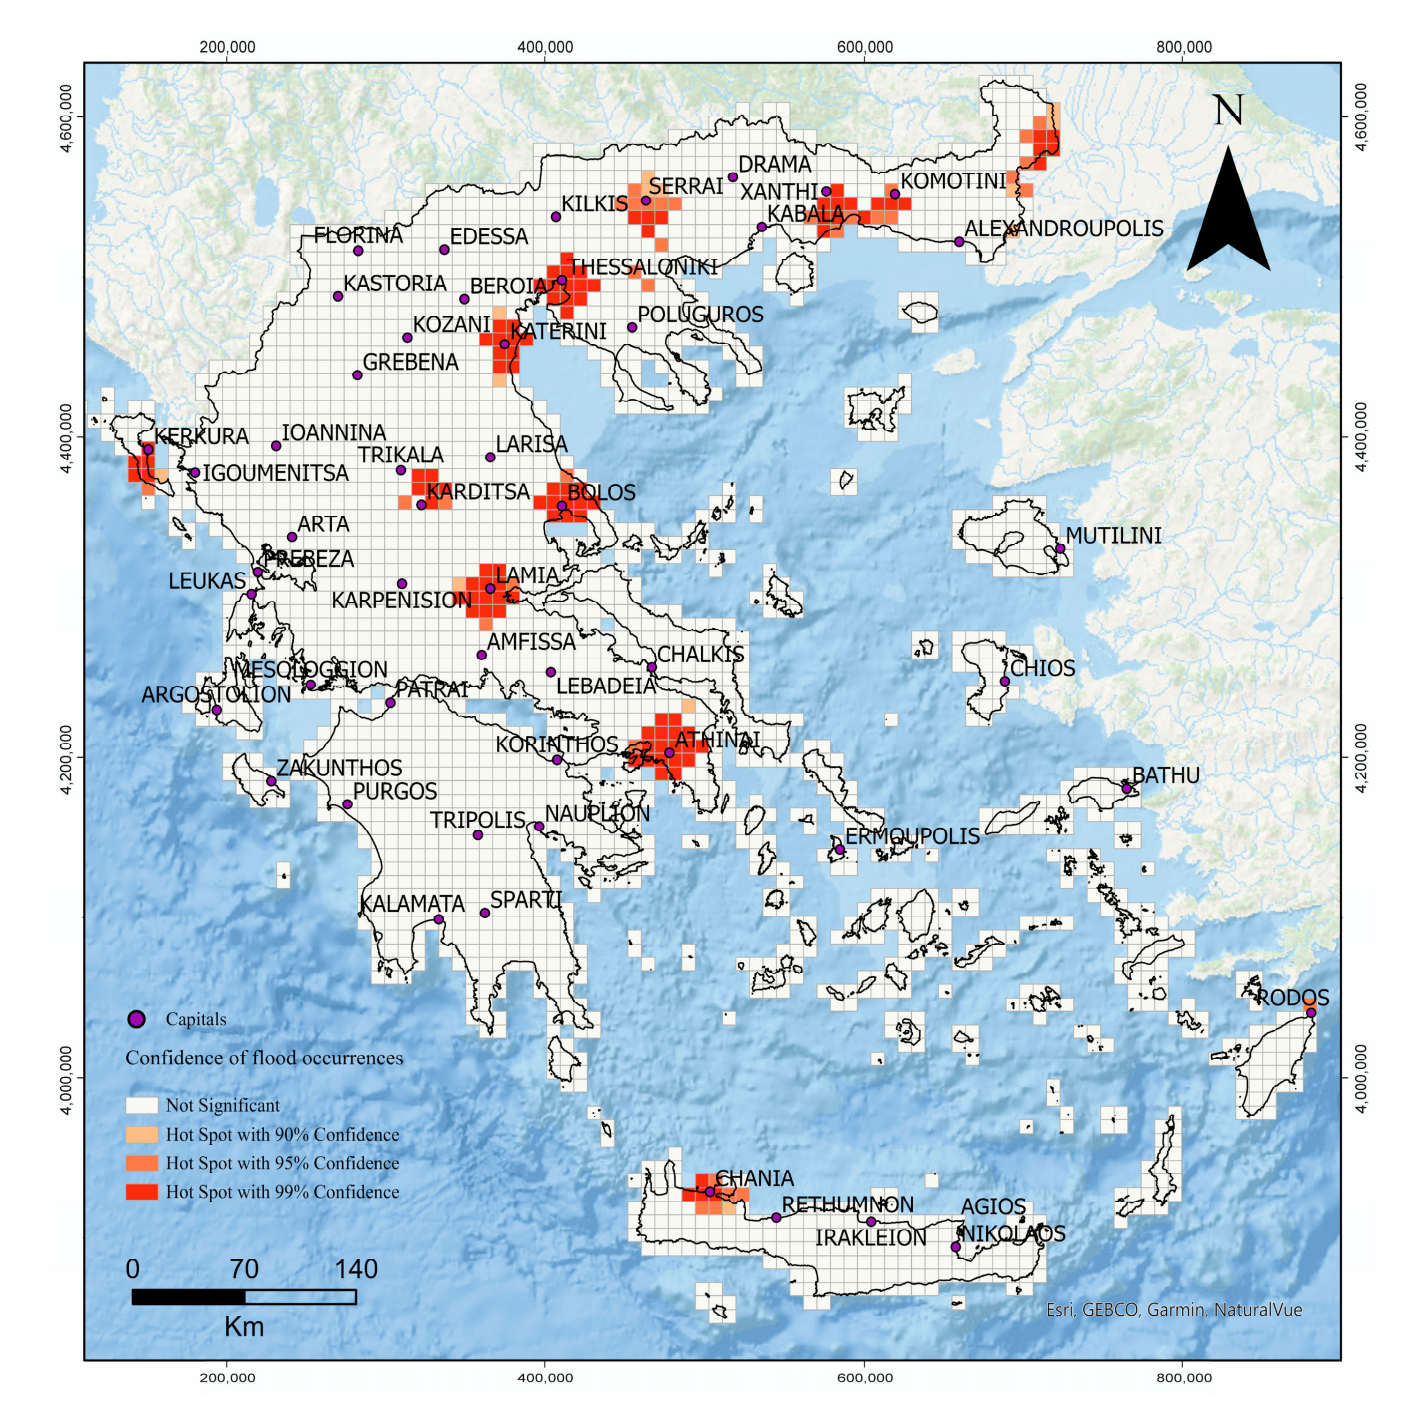
Evelpidou, N., Cartalis, C., Karkani, A., Saitis, G., Philippopoulos, K., & Spyrou, E. (2023). A GIS-Based Assessment of Flood Hazard through Track Records over the 1886–2022 Period in Greece. Climate, 11(11), Article 226. doi:10.3390/cli11110226
1,992 historic riverine flood records from Greece (1886–2022).
Riverine, or fluvial, flooding is the temporary inundation of normally dry land when water from a river or stream extends beyond the usual natural or artificial confines of its channel.1,2,3,4,5,6,7,8
These mechanisms can act alone or in combination.
| Mechanism | Contribution |
|---|---|
| Rainfall | Rainfall-generated runoff.9 |
| Snow and ice melt | Snow or glacier-ice melt.10 |
| Water releases | Releases from reservoirs or natural lakes.11,12 |
| Blockages | Ice or debris blockages and their sudden release.13,14 |
| Failures and backwater | Failure of natural or artificial dams or embankments.15,16 Downstream backwater effects, including high sea levels impeding river discharge.17 |
| Earthquake effects | Earthquake-induced channel deformation or diversion through surface fault rupture.18 |
| Reduced conveyance | Sediment accumulation, channel narrowing or structural constrictions that reduce channel capacity.19,20 |
| Groundwater contribution | Groundwater discharge into rivers, which can contribute to and sustain flooding.21 |
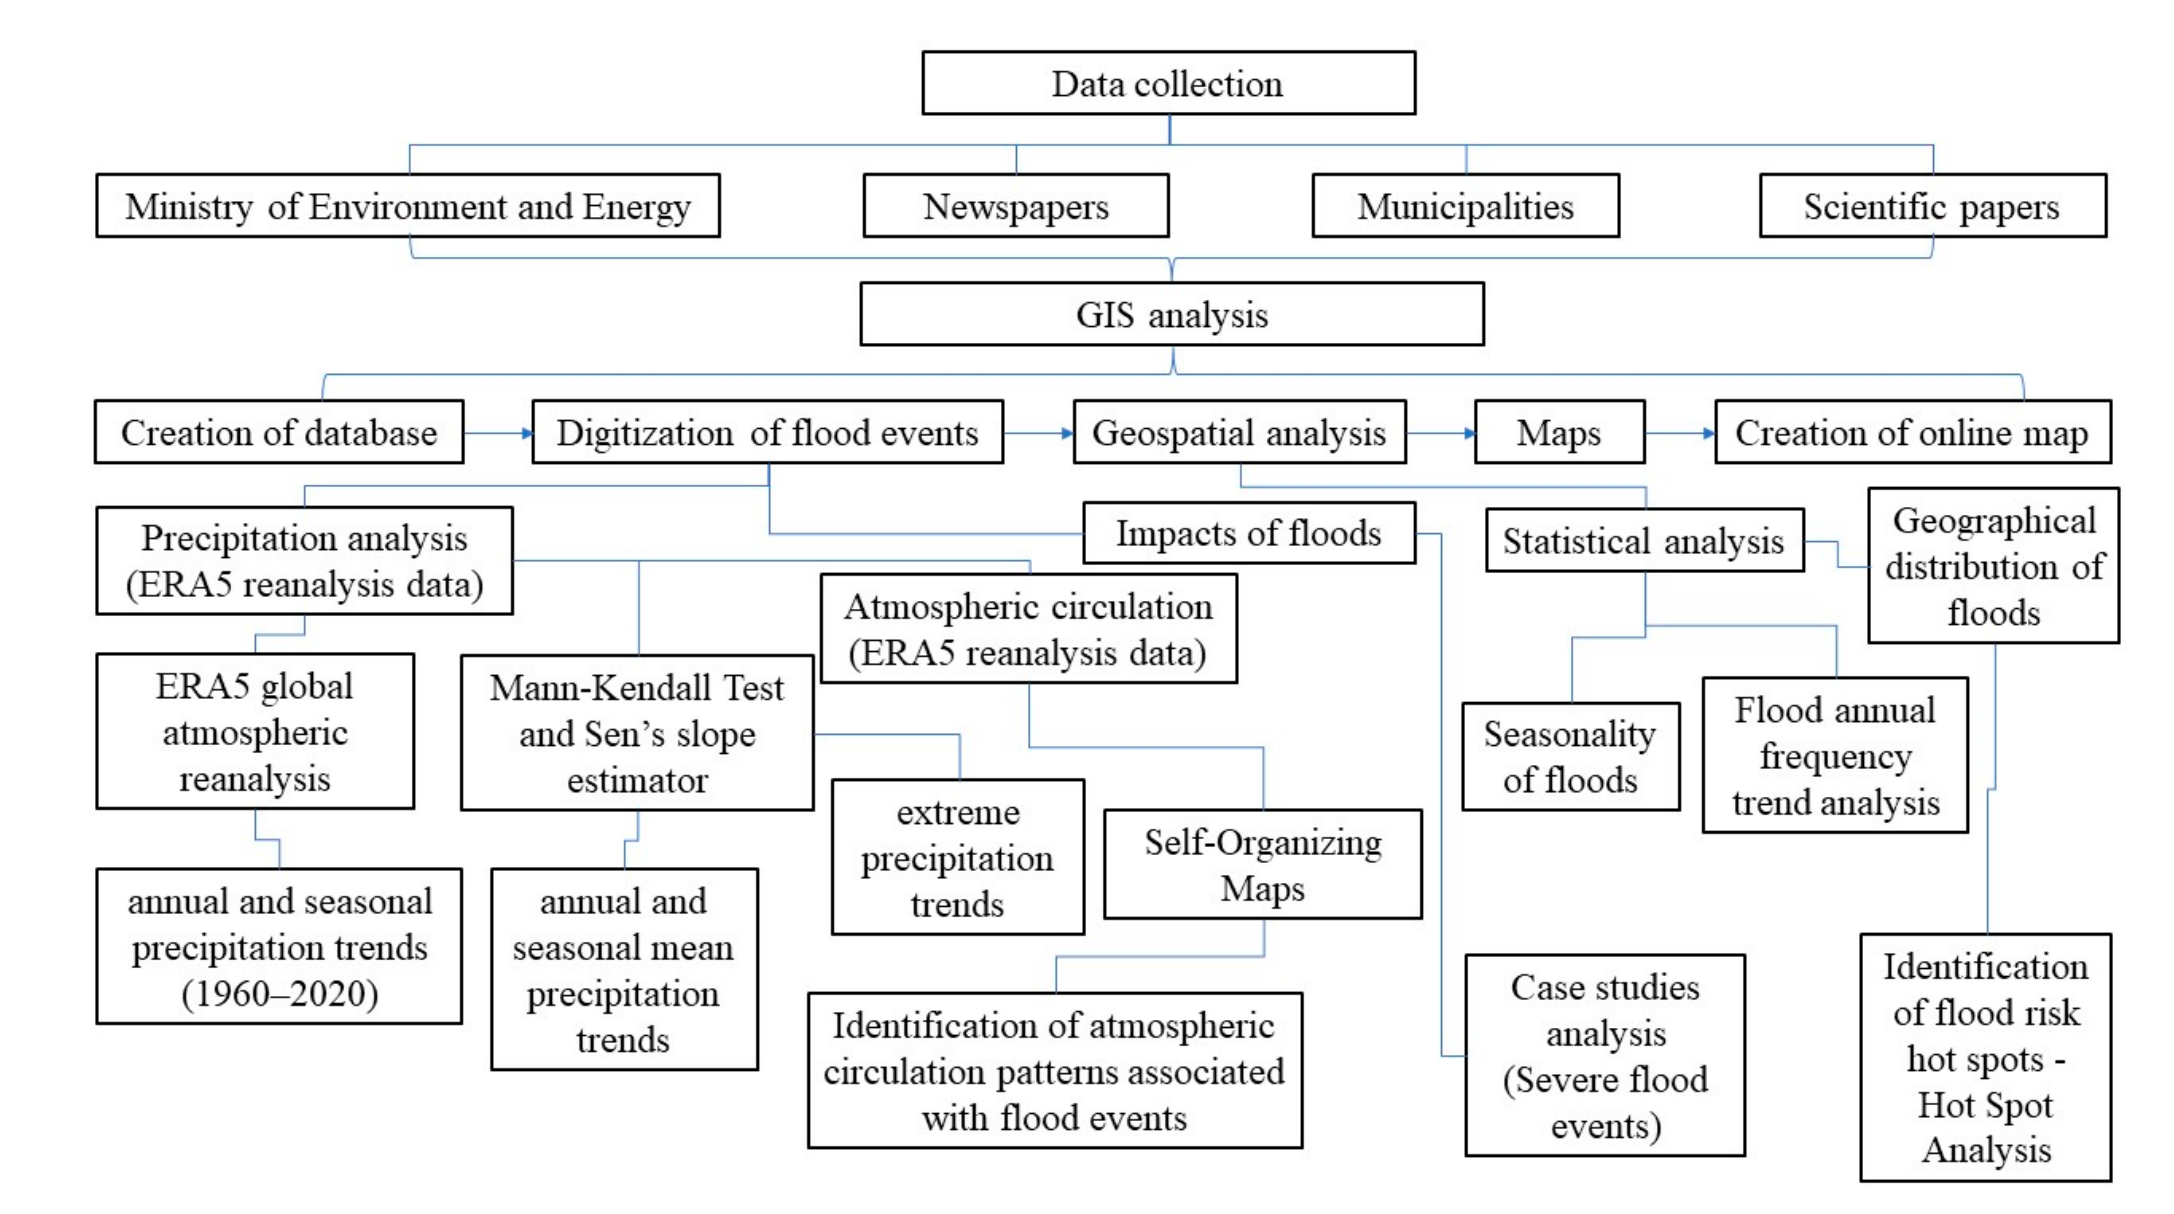
Evelpidou et al. (2023) compiled the catalogue from six source groups:22
Newspaper-derived events were cross-checked against ministry material, municipal archives or scientific papers. Information from municipality websites was confirmed through scientific publications.22
The catalogue records flood locations, with additional observations where available and applicable.22
| Information | Availability |
|---|---|
| Coordinates | Flood location |
| Administrative units | Regional unit and municipality |
| Rainfall duration | Where available and applicable |
| Rainfall amount | Where available and applicable |
| Deaths | Where available and applicable |
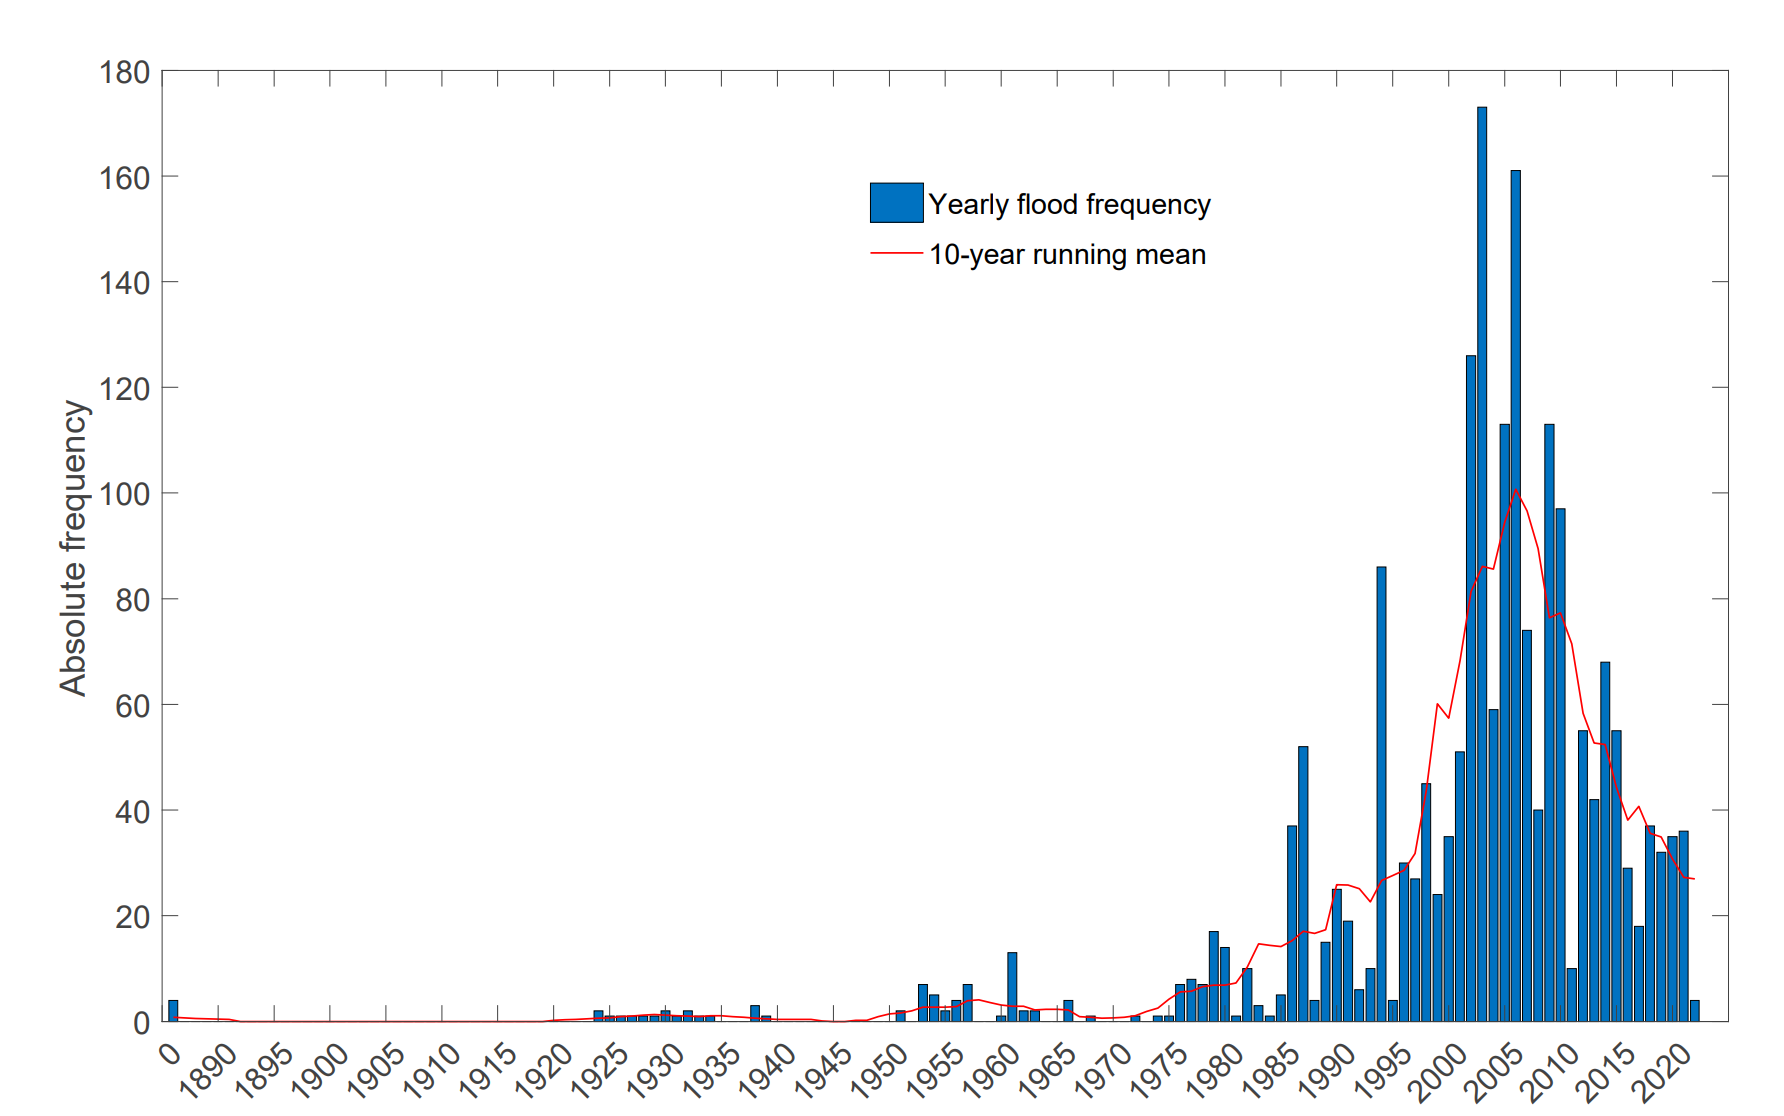
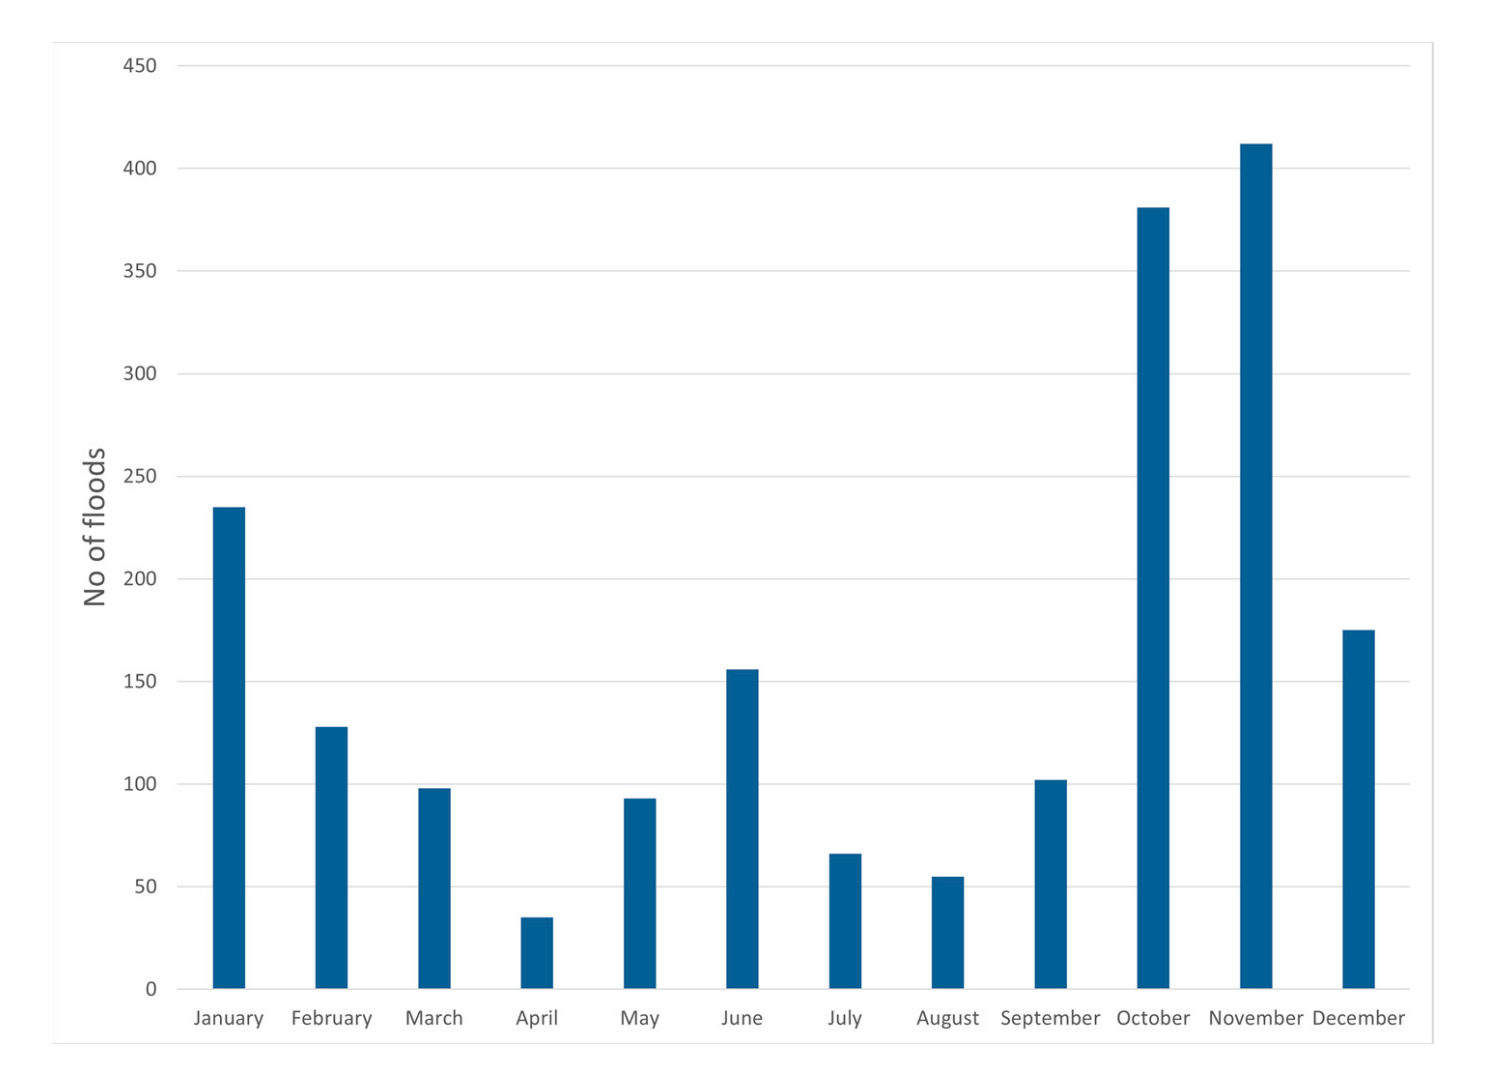
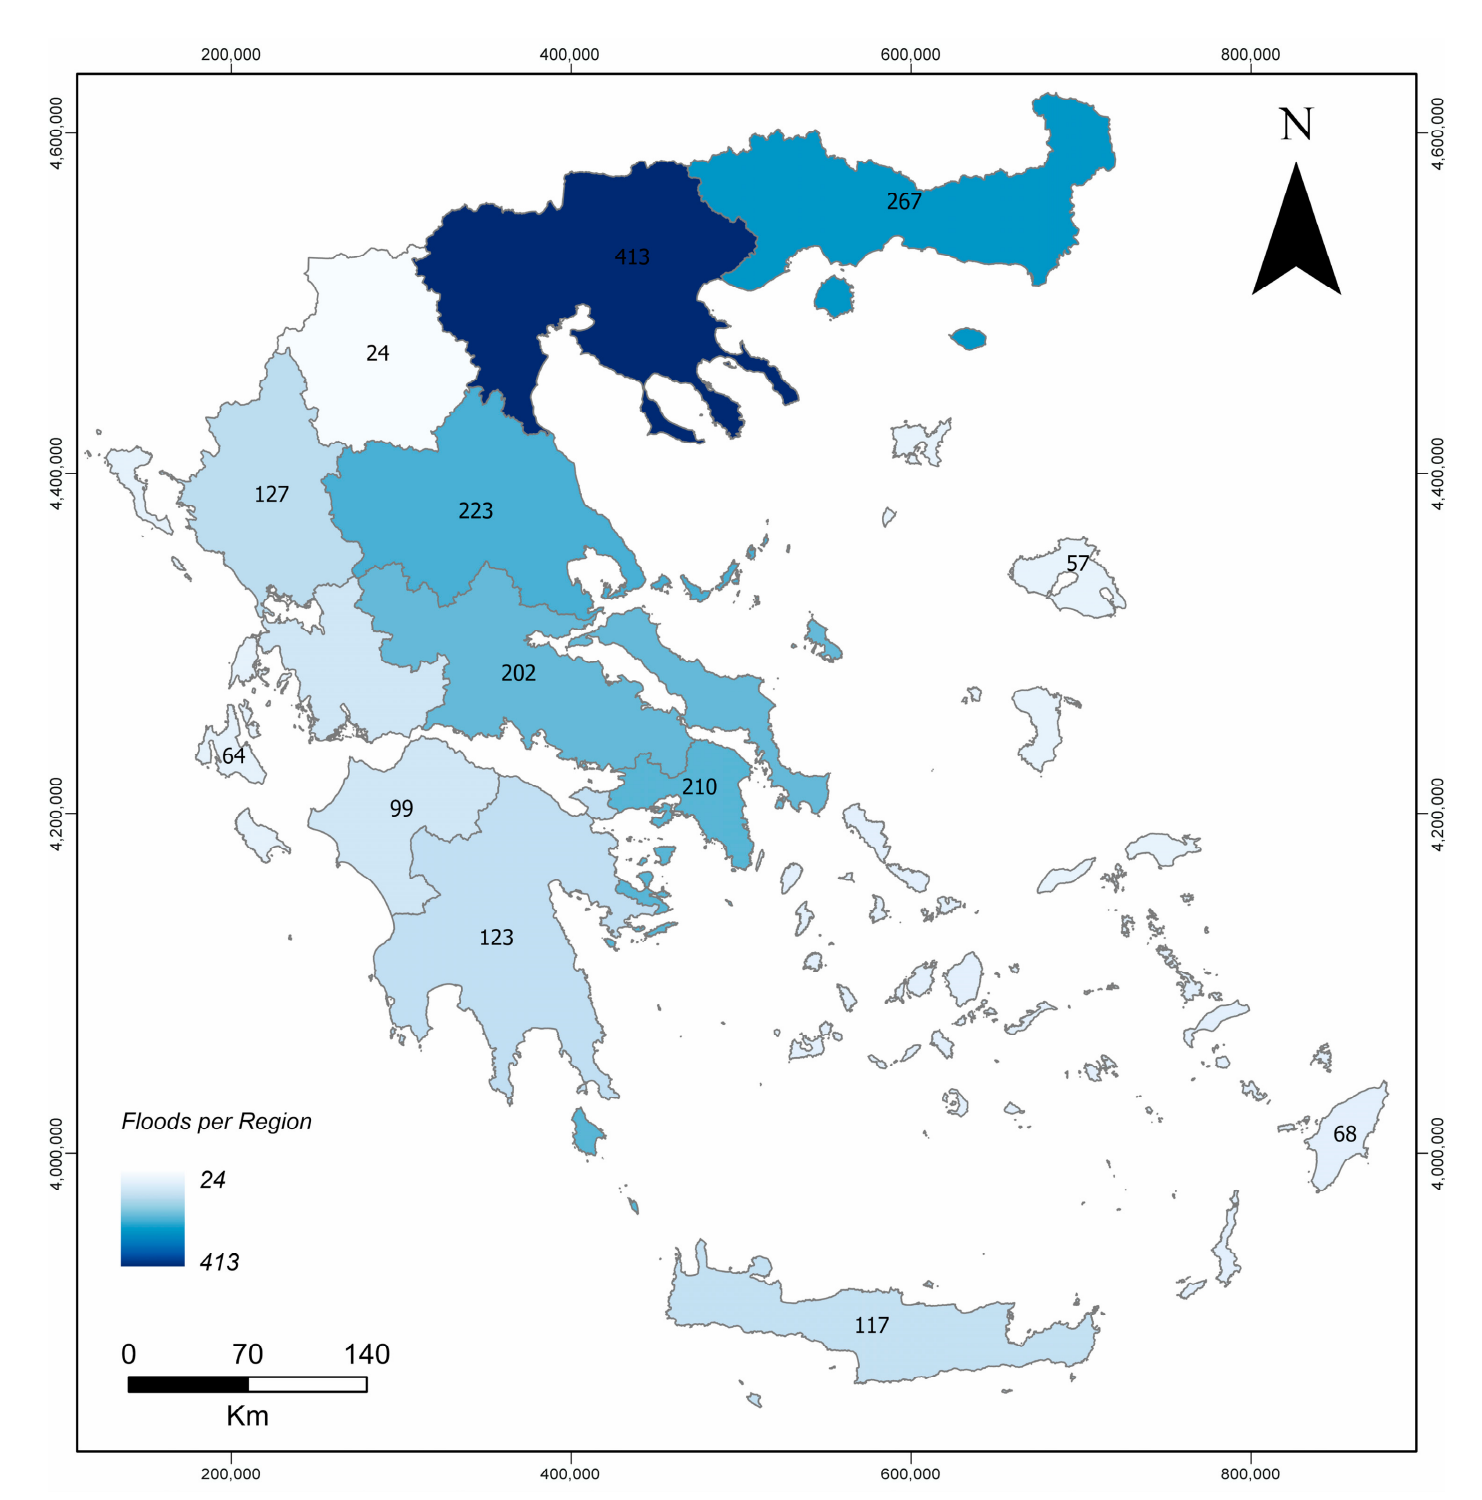
Original results from the published catalogue of 1,994 events. These figures remain unchanged when WebGIS filters are applied.22
Figures: Evelpidou et al. (2023), Climate 11(11), 226 · CC BY 4.0.
The NKUA dataset contains 1,992 source records for Greece (1886–2022). Map pins show catalogue locations. Record details retain the recorded dates, locations, causes, impacts and supporting sources where available. Records that share a reviewed map pin retain their individual source references and observations.
NKUA records are assigned Riverine under Water source, following the catalogue’s river, stream and torrent overflow scope.22 The other criteria—onset / response, generating process, inundation mechanism, sediment behaviour, setting and interacting drivers—remain Unclassified. The mechanisms described above are background information, not individual event assignments.
Search and filters update the map and statistics, which count source records. Map layers control visibility. Display settings let you colour records by dataset, a classification criterion or year classes. Year boundaries and colours remain stable while filters update the class counts.
Missing information is left unreported; an explicit zero remains a recorded value. Published study figures and interactive WebGIS statistics are presented separately.
2,961 records across 40 countries and territories (1870–2025), including 127 in Greece. Dataset licence: CC BY 4.0.
Map pins are display locations within affected administrative regions, rather than observed flood-site coordinates. The region polygons do not represent inundation boundaries.
Paprotny, D. (2026). HANZE database of historical flood impacts in Europe, 1870–2025 (Version 3.0.1 beta) [Data set]. Zenodo. doi:10.5281/zenodo.20478847
Paprotny, D., Terefenko, P., & Śledziowski, J. (2024). HANZE v2.1: an improved database of flood impacts in Europe from 1870 to 2020. Earth System Science Data, 16(11), 5145–5170. doi:10.5194/essd-16-5145-2024
Paprotny, D. (2024). HANZE catalogue of modelled and historical floods in Europe, 1950–2020 (Version 1.2, historical List B only) [Data set]. Zenodo. doi:10.5281/zenodo.12635205
Paprotny, D., Rhein, B., Vousdoukas, M. I., Terefenko, P., Dottori, F., Treu, S., Śledziowski, J., Feyen, L., & Kreibich, H. (2024). Merging modelled and reported flood impacts in Europe in a combined flood event catalogue for 1950–2020. Hydrology and Earth System Sciences, 28, 3983–4010. doi:10.5194/hess-28-3983-2024
HANZE retains its river, flash, coastal and combined river/coastal types. The main catalogue also supplies flood profiles distinguishing fluvial, flash, coastal, estuarine, snowmelt and ice-jam flooding. Other criteria remain Unclassified where the catalogue provides no classification.
Counts refer to source records, which can describe the same wider flood episode. Unresolved cross-catalogue matches remain separate.
The collection combines 2,724 records from the v3.0.1 beta flood-impact database with 237 documented historical floods from List B (1950–2020). The main release was published on 31 May 2026 and is a preliminary update supported by the European Commission Joint Research Centre. List B does not provide precise impact totals; missing values remain unknown. Only historical records are included from the companion release.
Original IDs, date intervals, approximation flags, types, profiles, notes and references are retained, with the release identified in each record. Main-catalogue losses are adjusted to 2025 euros. Its geometry uses the provider’s 2024 administrative regions; List B retains simplified 2021 regions. Both are transformed from EPSG:3035 to EPSG:4326.

Ministry of Environment and Energy, General Directorate of Water. River Basin Management Plans [Geospatial data]. Official geoportal.
The reference layers show 1,322 river sections from the second revision of the management plans and 46 river basins.
The river inventory does not include every small stream or torrent. These layers show reference rivers and basin boundaries, rather than historic river courses or flood extents.
The official river dataset is Ποτάμια Υδατικά Συστήματα – 2η Αναθεώρηση (gr_rwb_greece_2rev). Its 1,322 features represent river sections, not distinct rivers, with 1,319 unique official identifiers. It includes natural, heavily modified and artificial water bodies; their official status is shown in the river details.
The basin dataset (egy_rb_new_2014) retains its original names and boundaries; it is not a newly mapped second-revision layer. Official designation alone does not establish that every river section was individually surveyed.
Original Shapefiles retain source attributes and geometry in EPSG:2100, with ISO-8859-7 Greek text encoding. For map display, river lines use 50 m generalisation at overview scales and full geometry when zoomed in; basin outlines use 100 m generalisation.
Esri. World Imagery [Satellite basemap]. Source & terms.
OpenFreeMap. Positron [Basemap]. © OpenMapTiles, with data from OpenStreetMap contributors.
Original platform text, interface, visualisation design and research outputs are licensed under CC BY 4.0. Give appropriate credit, link to the licence and identify changes when reusing them. Third-party datasets, basemaps, imagery, logos and source materials retain their own terms.
Submit a historic flood event or correct an existing record. Use one row per affected location and event date, with a traceable source and documented impacts.
Fill in the blank Data sheet in the XLSX workbook. The Field guide describes every column, its units and examples. You can also use the CSV with the same headers.
Leave unknown values blank. For a correction, include the existing id and explain the change in submission_notes.
| Field and column | Format and unit | What to provide |
|---|---|---|
Event start datedate_of_commencement | YYYY-MM-DD (text) | Documented start date as YYYY-MM-DD text, including dates before 1900. If the exact date is uncertain, explain the documented date in submission_notes. |
Countrycountry | Text | Country containing the submitted site. Contributions are not limited to the current geographic coverage. |
Administrative area or localitylocation_name | Text | Administrative area or locality affected by the flood. |
Affected place or eventflood_event_name | Text | Specific affected settlement, site or recognised event name. |
Latitudelatitude | WGS84 (degrees) | WGS84 decimal latitude. Use a minus sign south of the equator. |
Longitudelongitude | WGS84 (degrees) | WGS84 decimal longitude. Use a minus sign west of Greenwich. |
Supporting sourcesource | Text | Traceable publication, DOI, report or source URL supporting this record. Include page or figure numbers where relevant. |
| Field and column | Format and unit | What to provide |
|---|---|---|
Existing record IDid | Whole number | For a correction, copy the ID of the existing map record. Leave blank for a new record. |
Recorded fatalitiesdeaths_toll_int | Whole number | Number of recorded deaths. Blank means unknown. Zero means explicitly none. |
Reported causecause_of_flood | Text | Cause of the flood as documented by the source. |
Rainfall durationrainfall_duration | Text | Reported duration including its unit, such as hours or days. |
Rainfall amountrainfall_height | Text | Reported precipitation depth including unit and measurement period. |
Documented impactsrelevant_information | Text | Recorded damage, affected infrastructure and other relevant event details. |
Submission notessubmission_notes | Text | Explain corrections, coordinate accuracy, measurement methods, vertical datum and any uncertainty. Identify attachments here. |
Include contributor names, affiliation and contact details in your email. Attach the completed file and supporting sources manually. The research team reviews each submission before publication.
Found something wrong? Help us improve by reporting bugs or data errors.
Have an idea to make Historic Floods better? We welcome suggestions for new features and improvements.